Research2024.03 – 2026.08
Wavenumber correlation of gravity & magnetic data for salt/basement structure (M.S. · SPE Journal first author)
Separated overlapping gravity and magnetic signals in the wavenumber domain to resolve salt and basement structures offshore Abu Dhabi
Input
Airborne gravity data
Airborne magnetic data
Ghasha, offshore Abu Dhabi — salt and basement overlap under 8–10 km of sediments- 1Upward continuationHeight = knee of the correlation-change curve (1,500 m)
- 2NormalizationPut two different units on one scale
- 3Wavenumber correlation filtering (WCF)Correlation CC(k) per wavenumber
- 4IndicesSLFI · CC(k) 0.5 ~ 1.0 → basementDLFI · CC(k) −1.0 ~ −0.5 → saltBand chosen from the correlation vs. retained-energy curve
- 5Independent validationThree existing models from different methods — map overlay · 4 profiles · 3D density sections
Output
Basement structure (SLFI) agrees with 3 independent models
Salt distribution (DLFI) + possible extra uplift west of Ghasha
Problem
In the Ghasha field offshore Abu Dhabi, salt and basement lie under 8–10 km of sediments, so gravity and magnetic signals overlap; earlier methods put the salt at ~6,000 m, far shallower than the ~9,300 m seen in seismic data
My role
Propose an analysis that separates basement and salt signals in airborne gravity and magnetic data
What I did
- Built a wavenumber correlation filtering (WCF) pipeline — upward continuation and normalization, then the correlation coefficient CC(k) between the two signals at each wavenumber
- Designed two indices — SLFI from positively correlated components (basement) and DLFI from weak/negative ones (salt)
- Chose thresholds from energy–correlation trade-off curves instead of by eye (upward continuation 1,500 m at the knee point; SLFI band 0.5–1.0 keeps ~half the energy at correlation 0.85)
- Validated against three independent published models with map, profile and 3-D density comparisons
- Presented Abu Dhabi processing and analysis results at 10+ regular lab research meetings (2024.05–2026.01) and at the 2025.11 Basic Research Lab workshop
- Researcher on national R&D projects, including the IITP global talent program
Results
- SLFI basement structure agrees with three independent models at r ≥ 0.94 (profile correlation 0.95–0.98 after shift alignment)
- DLFI reproduces the salt distribution and suggests an additional salt uplift west of Ghasha
- First-author paper in SPE Journal (SCIE, 2026, with Univ. of Calgary and Khalifa Univ.) · 3 conference talks (2024)
- Best Student Paper (poster), KSEG Fall Conference 2024 · M.S. degree conferred 2026.08.21
Decisions & trade-offs
What I chose, and what I gave up for it
Correlation band: a narrower band raises the correlation but leaves less signal energy, so I plotted correlation and retained-energy ratio together and picked the balance point (SLFI: CC 0.5–1.0, keeping about half the energy) — a threshold that can be explained with a graph, not by feel.
Upward-continuation height: higher reduces shallow noise but blurs resolution; I chose the knee of the correlation-change curve (1,500 m).
Validation reference: a reference built from the same data is not validation, so I compared against three independent models from different methods (map overlay, four profiles, 3D density sections) — harder to obtain, but avoids circular validation.
Looking back · open questions
What I would change, and what is still open
The additional salt uplift west of Ghasha suggested by DLFI remains a hypothesis to confirm with other data such as seismic.
The real data belong to the joint project and stay private; the workflow is reproduced on synthetic data in gravmag-wcf. Applying the same procedure to another region is the next step.
 M.S. commencement
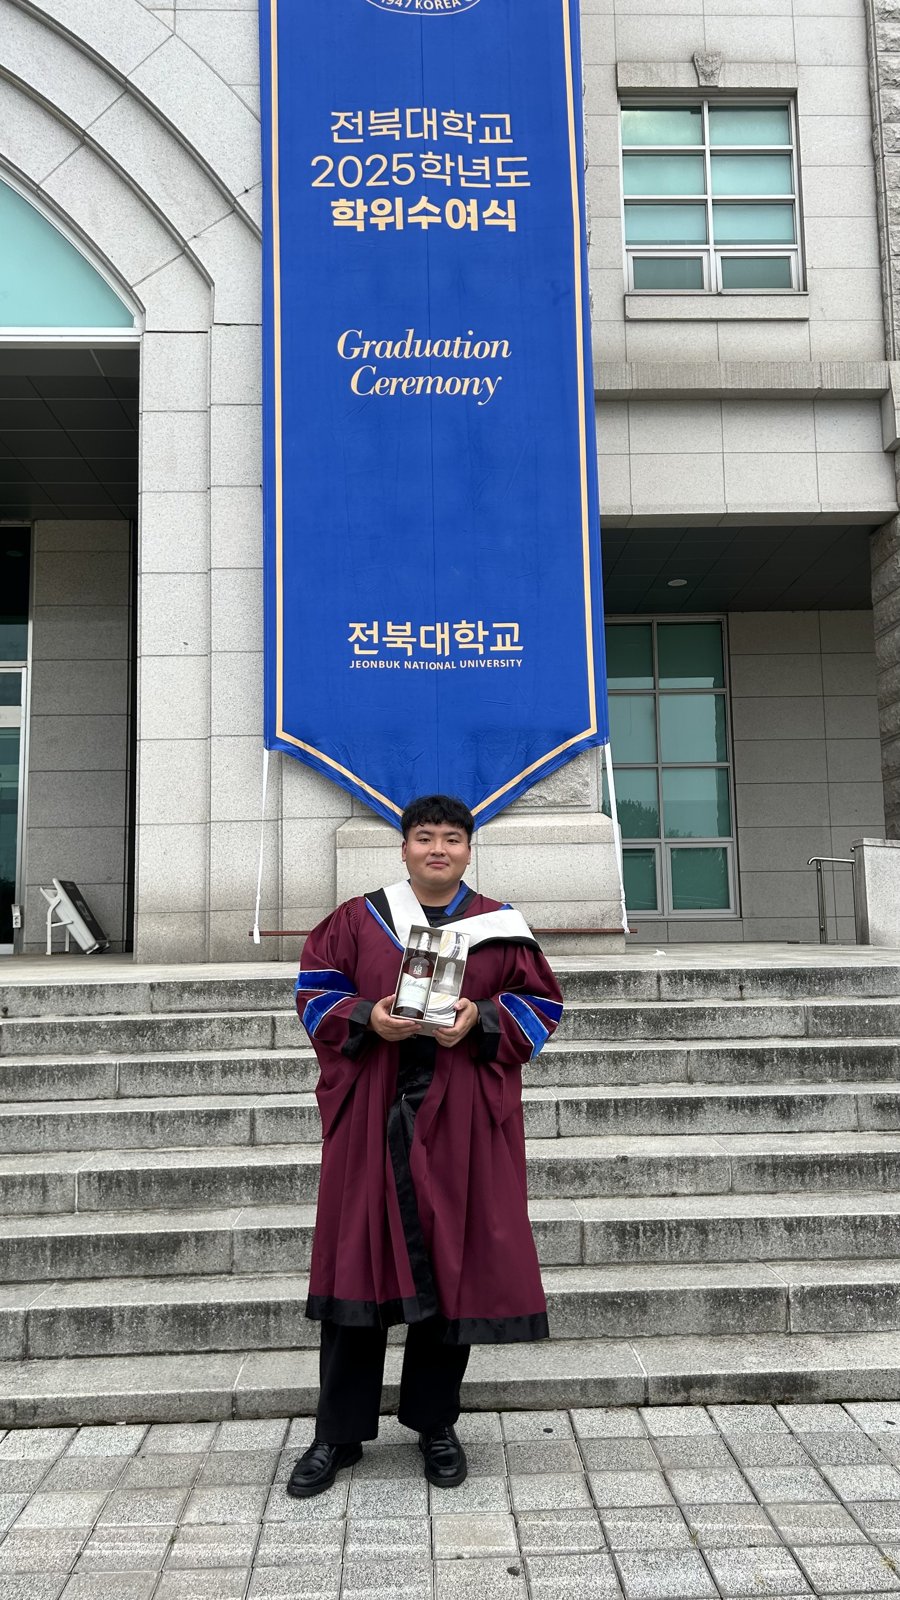 M.S. commencement
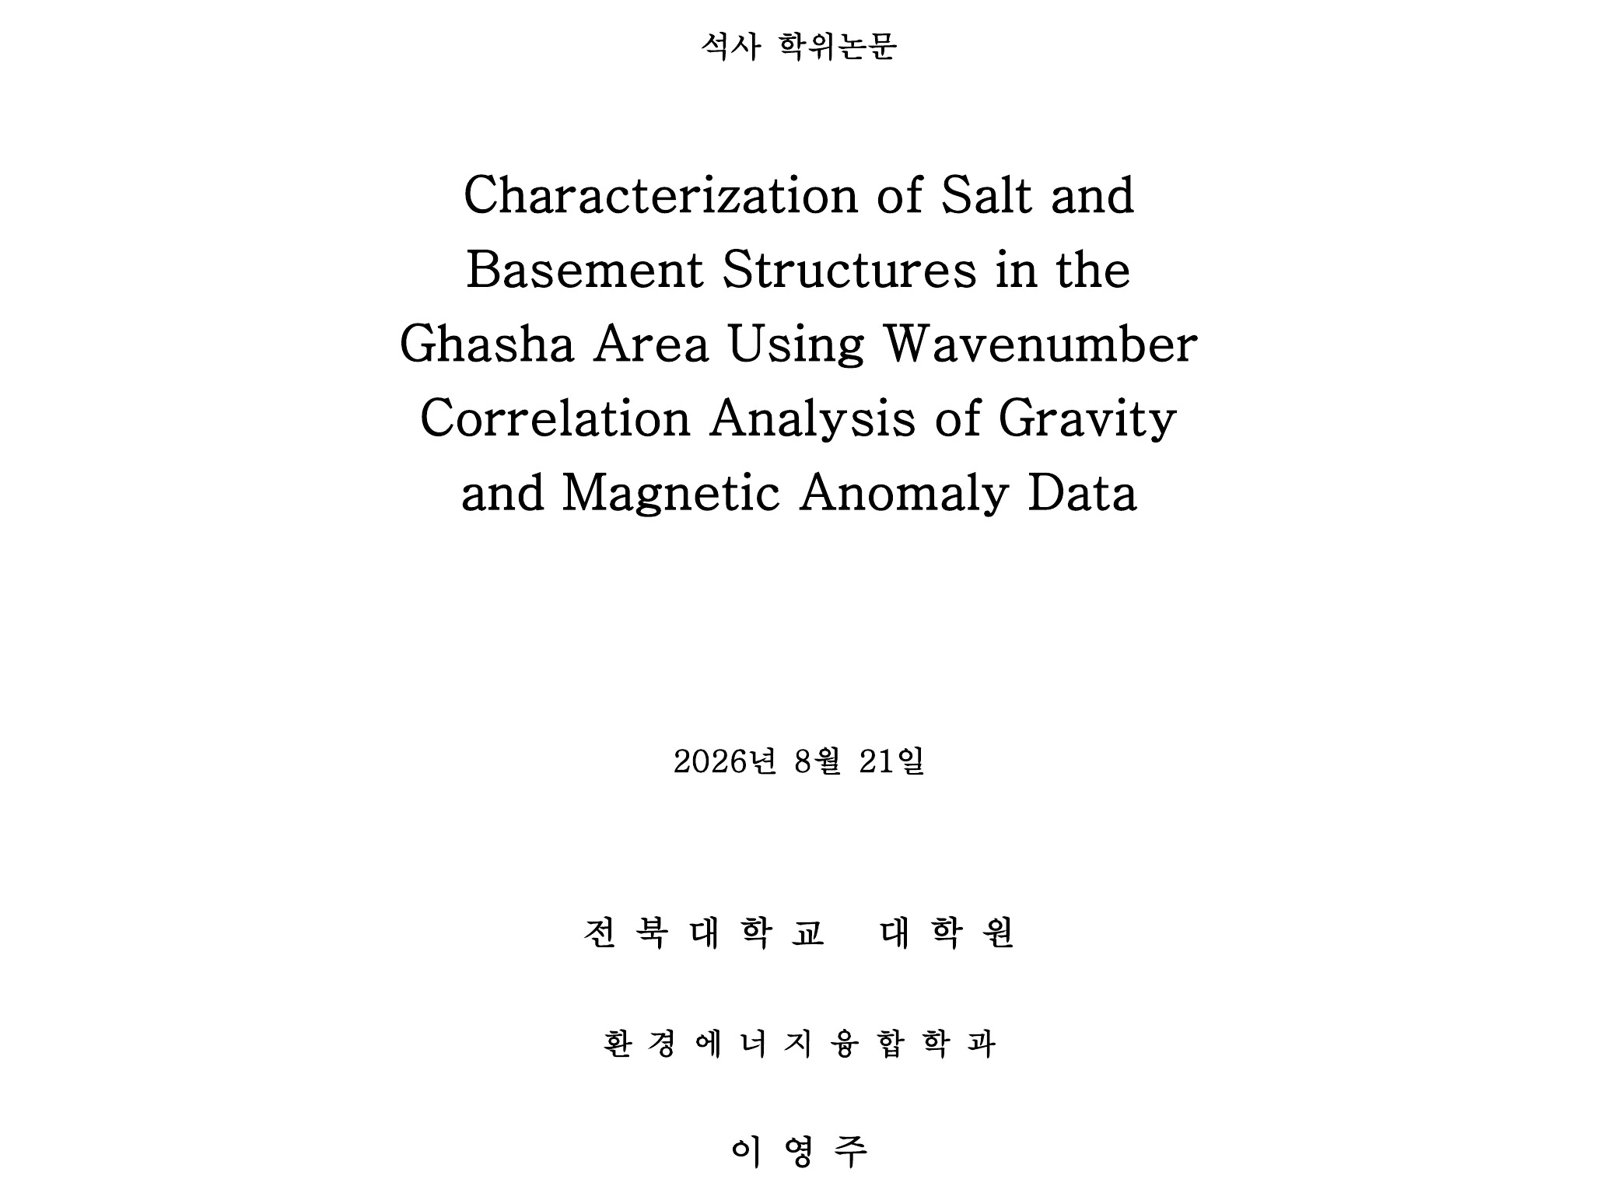 M.S. thesis — cover
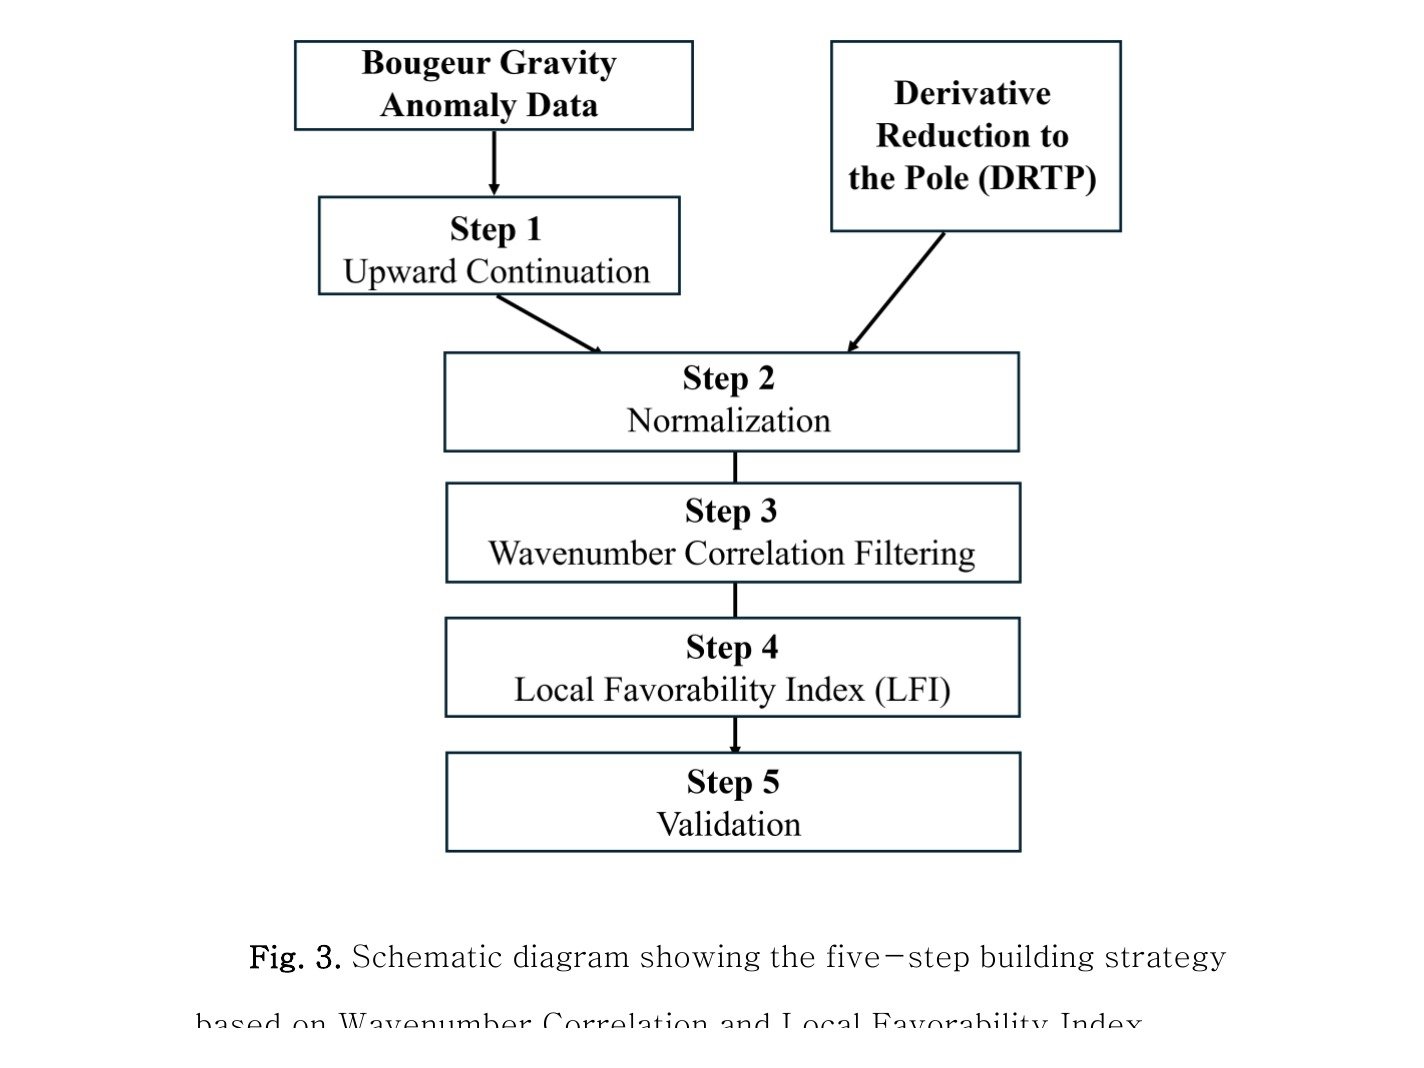 M.S. thesis Fig. 3 — WCF → LFI five-step workflow
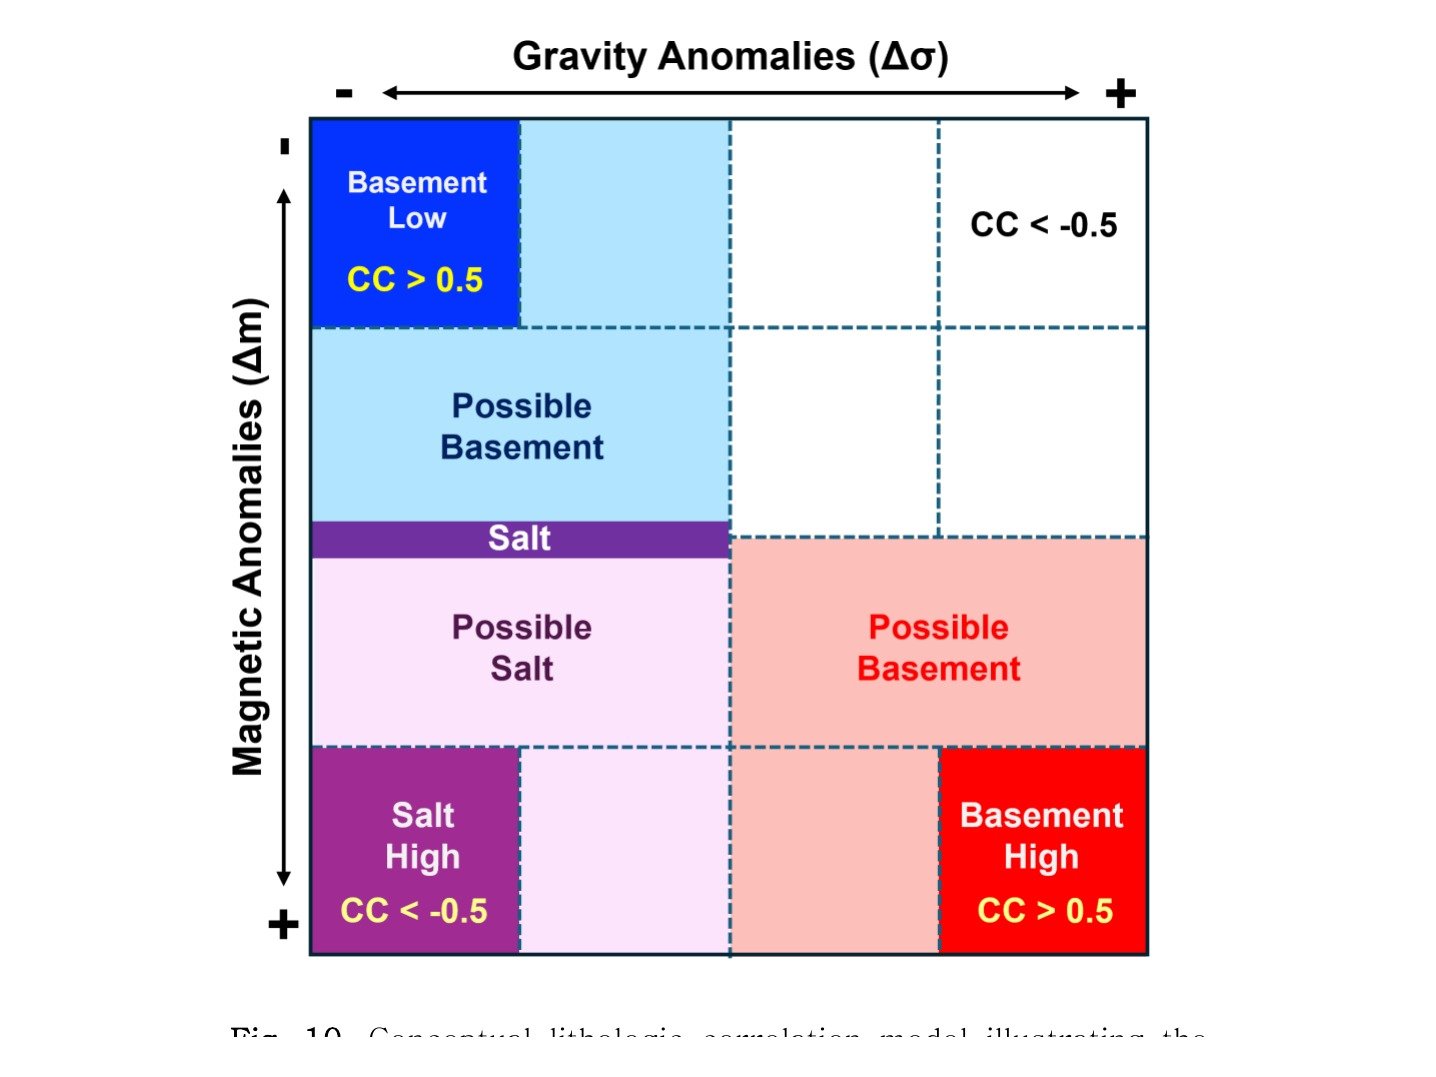 M.S. thesis Fig. 10 — basement/salt classes by CC(k) band
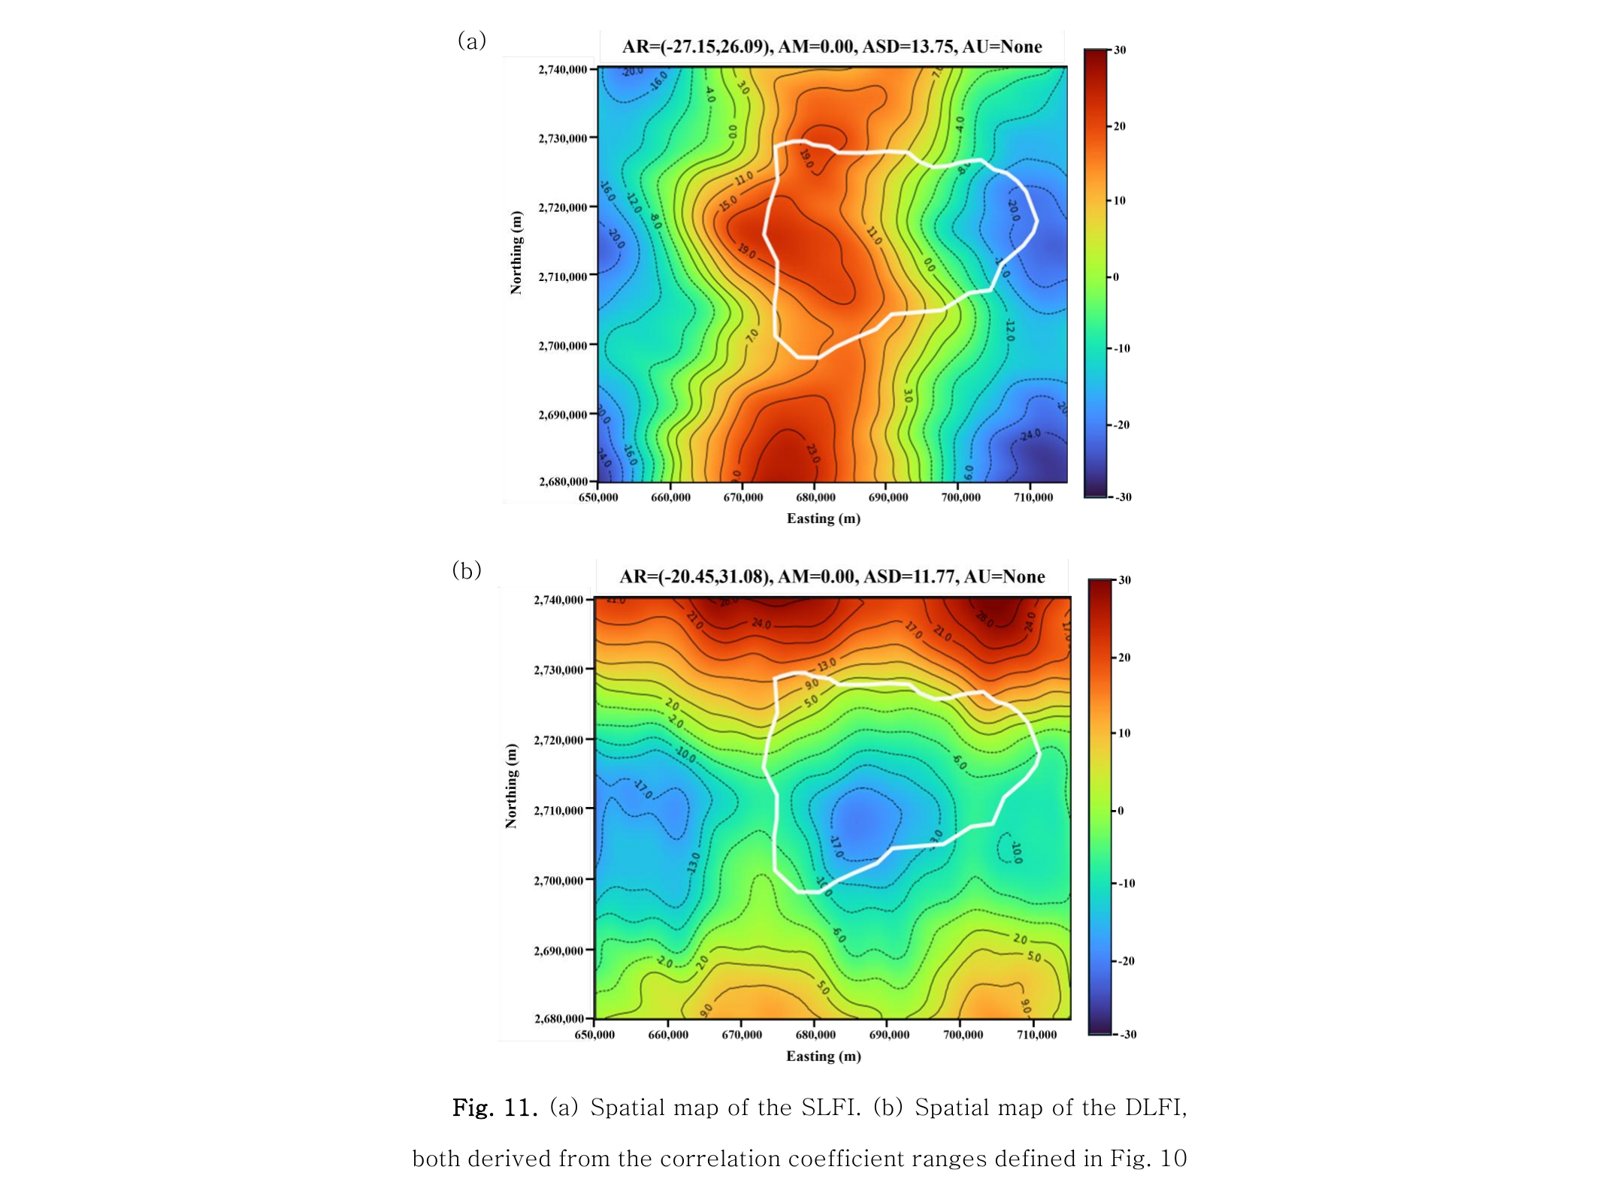 M.S. thesis Fig. 11 — SLFI (basement) · DLFI (salt) maps